We saw that the Ferrari had the fastest race pace of all, but in some points as the first sector lost compared to the McLaren and Red Bull. The T1 consists of a series of fast curves, in which the downforce demand is very high, also because of the very fast changes of direction that occur from one curve to another.
But too high a load can create problems with the next sector, where aerodynamic efficiency is very important. So you could opt for a very rigid suspension setup, to get the full potential of the floor, the idea would not be bad if there was the third sector, where instead you need a less rigid setup to exploit the potential of the rear.
So let’s see how the top 4 teams faced the T1 snake:
TURN 2 ANALYSIS:
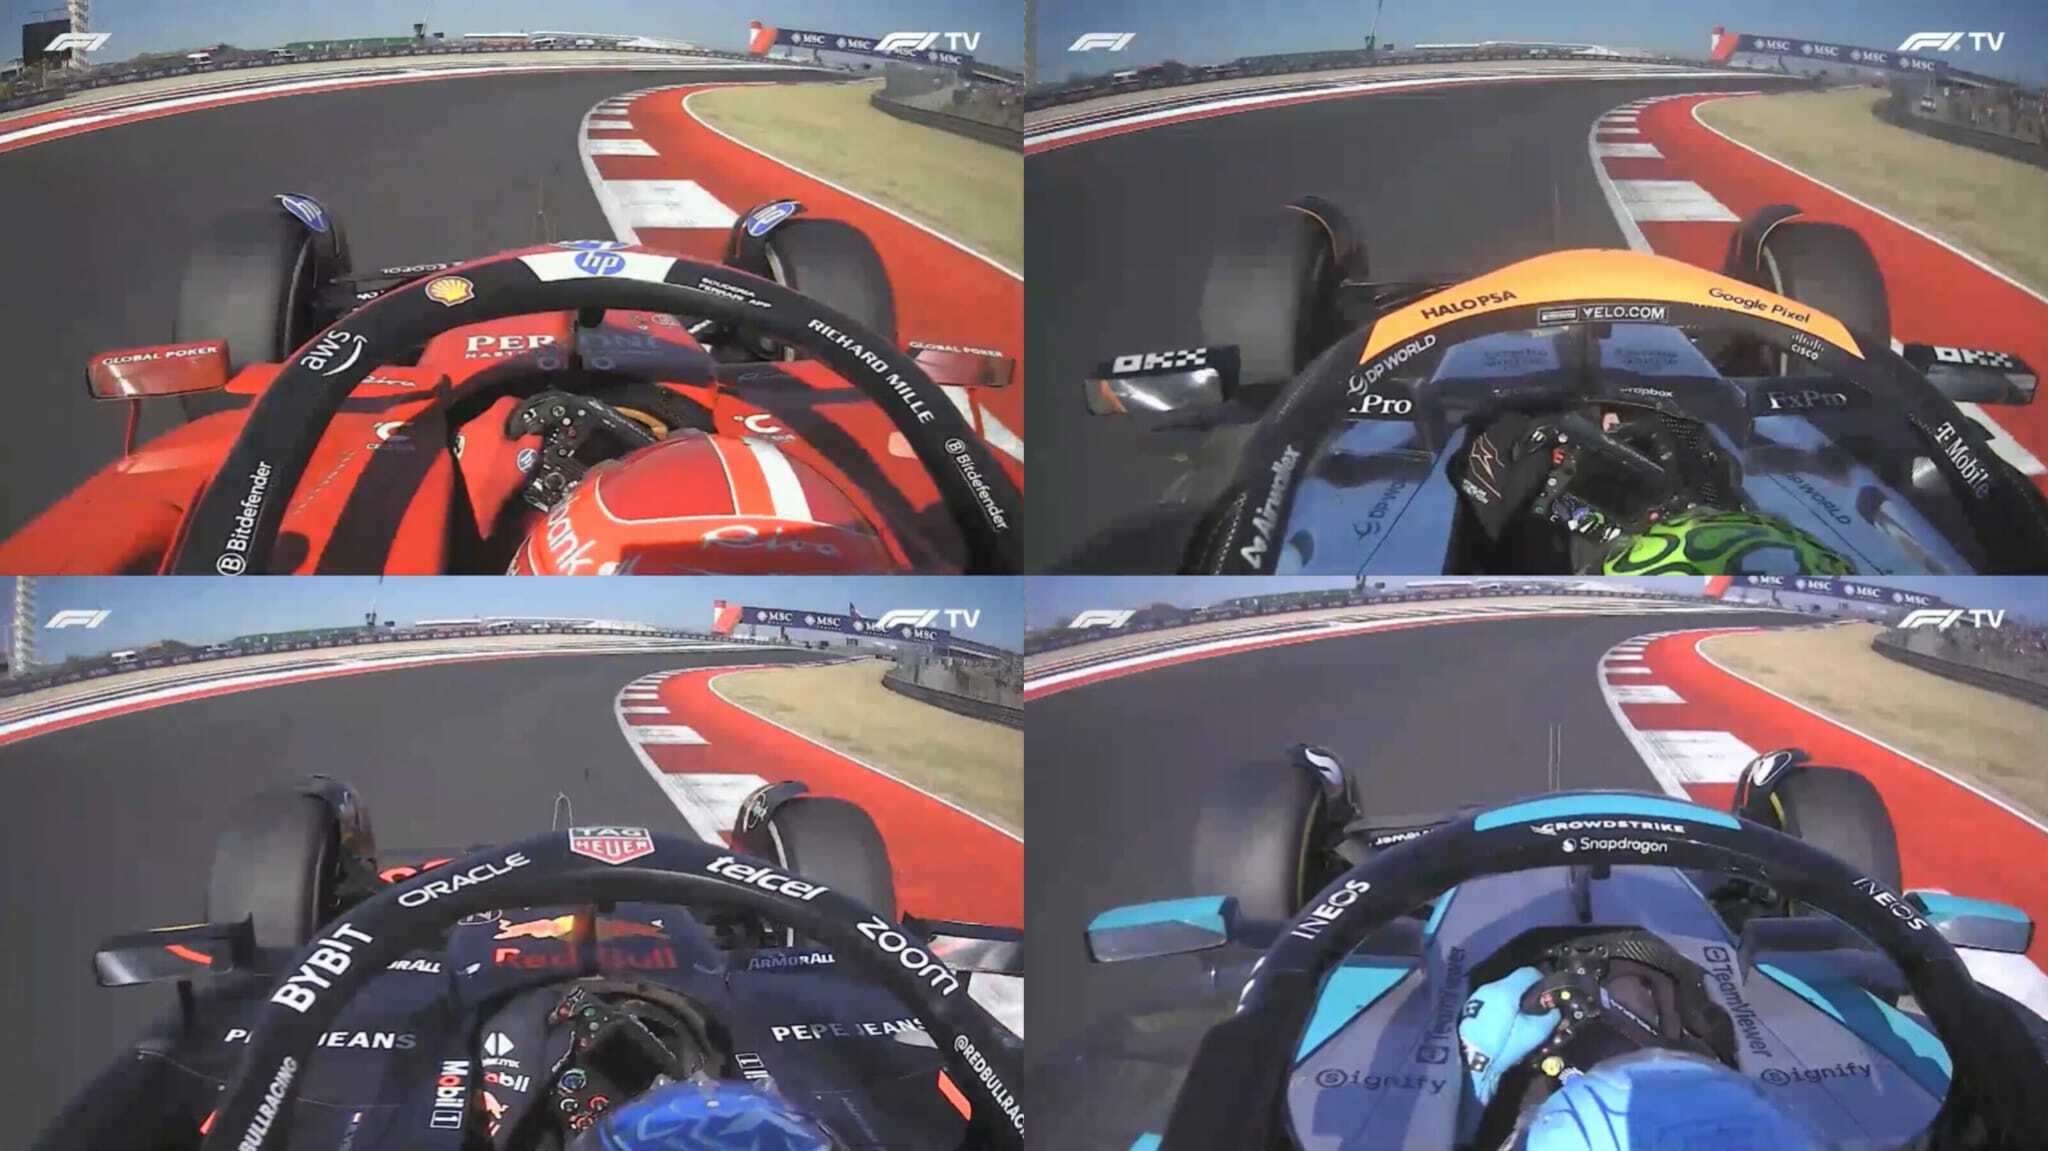
We start to observe the on-board (I tried as much as possible to take the same point), in T2 it would seem that the furthest from the kreb is the car n°1 of Max Verstappen, to follow the W15 of George Russell, Lando Norris’s McL38 and finally the one who seems to be most aggressive on the curb of T2 is Charles Leclerc with his SF24.
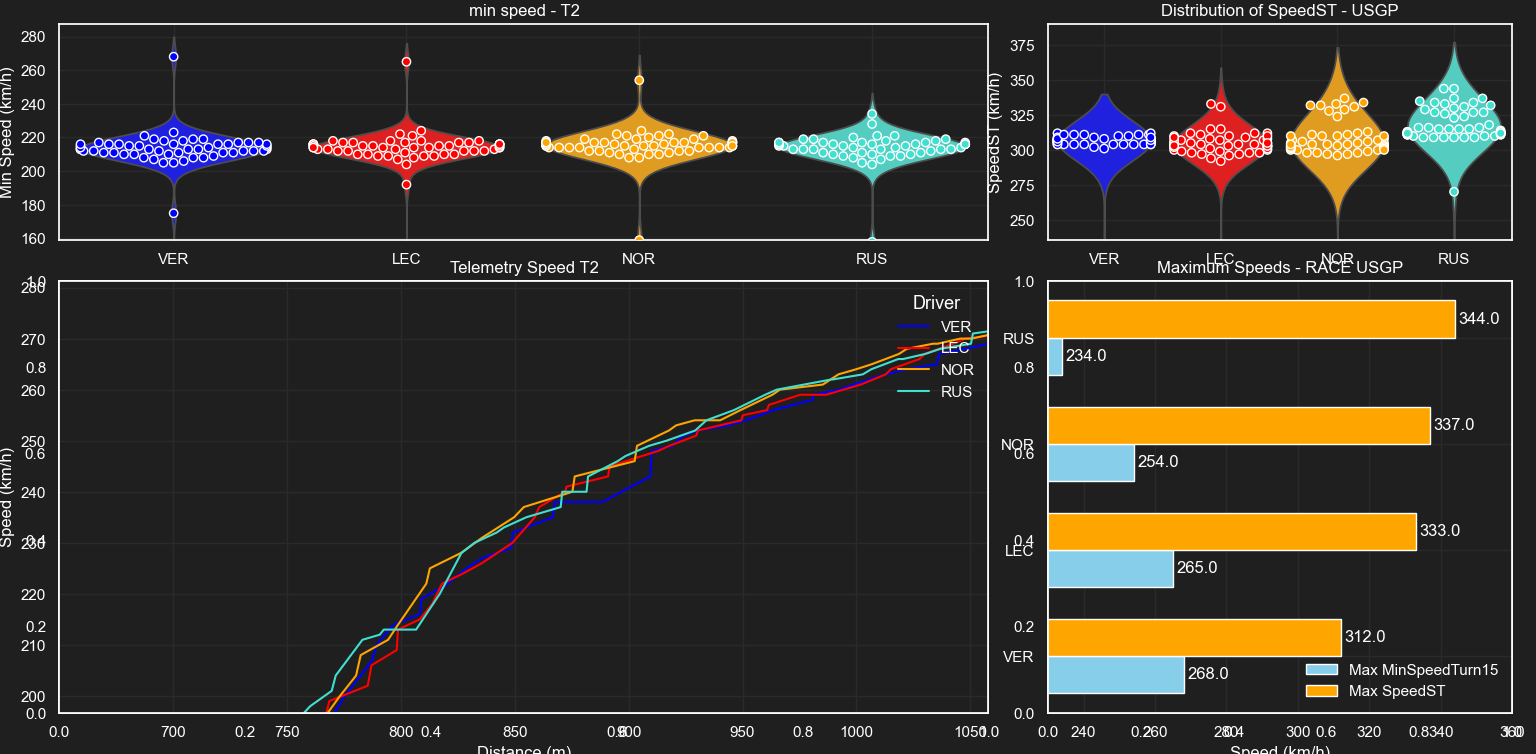
For a simpler view we can start to observe the histogram on the right (which indicates with the orange line the maximum speed, while that in blue the highest min speed recorded in the race).
During the whole race to have recorded the highest min speed was the Dutch, for only 3 km/h difference the Monegasque of Ferrari, for 14 km/h less we notice Lando Norris and with 34 km/h difference instead the W15 of George Russell.
With the violin plot in the upper left we can observe the diffusion during the whole race: that of SF24 by Charles Leclerc is the most constant, but the peak curve is not his but of Lando Norris, that of Russell is similar to that of Leclerc, and finally we find Max Verstappen.
In conclusion: in the t2 to have faced with greater speed for the whole race was the McLaren of the British, but to have recorded a maximum speed instead was the champion in charge.
TURN 3 ANALYSIS:
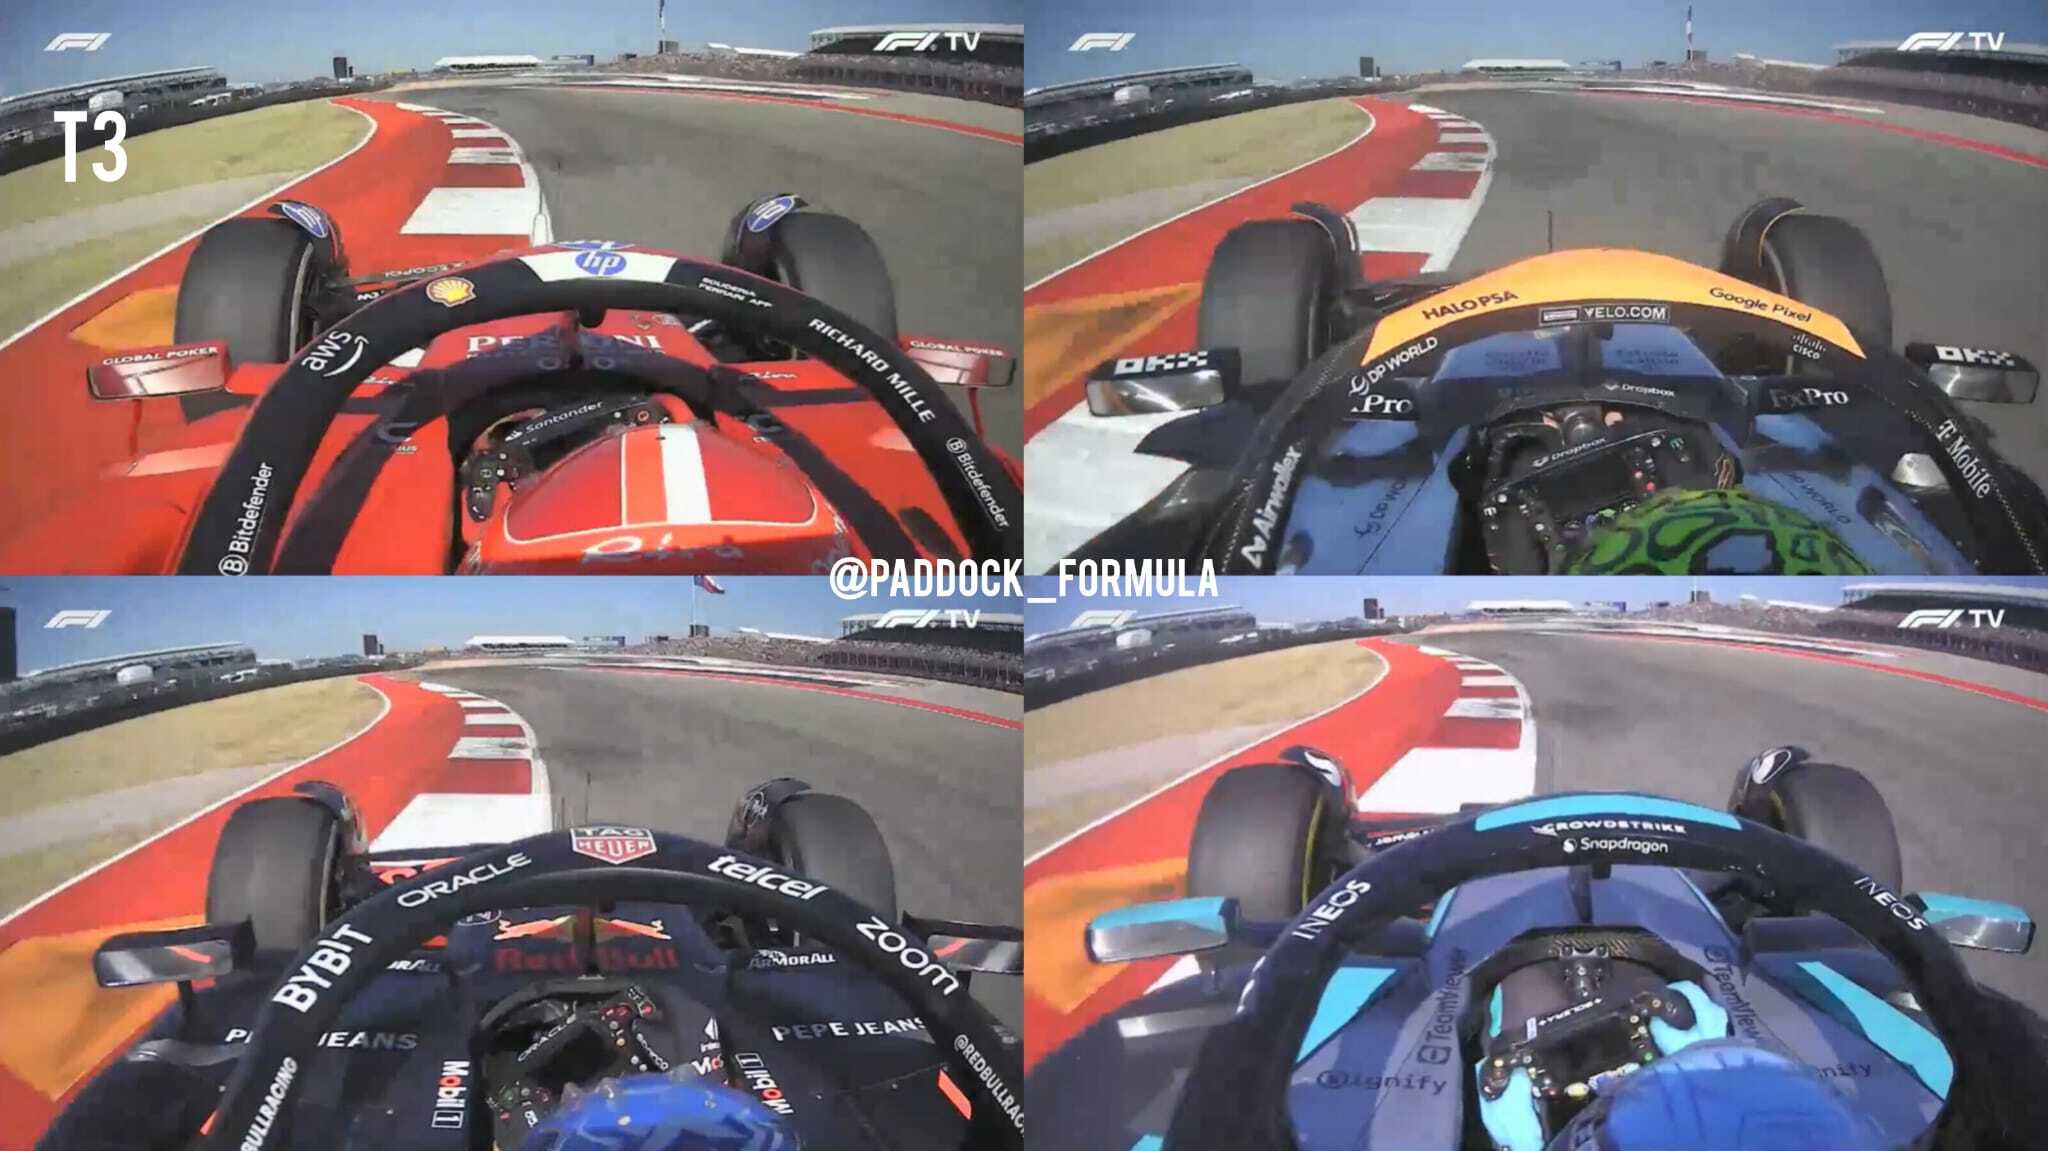
Again, the Ferrari is the one who manages to tackle the curve in a more aggressive way, exploiting all the curb, while in this occasion Lando Norris is the one who uses less the inner curb, while Verstappen and Russell tackle the curve in a similar way.
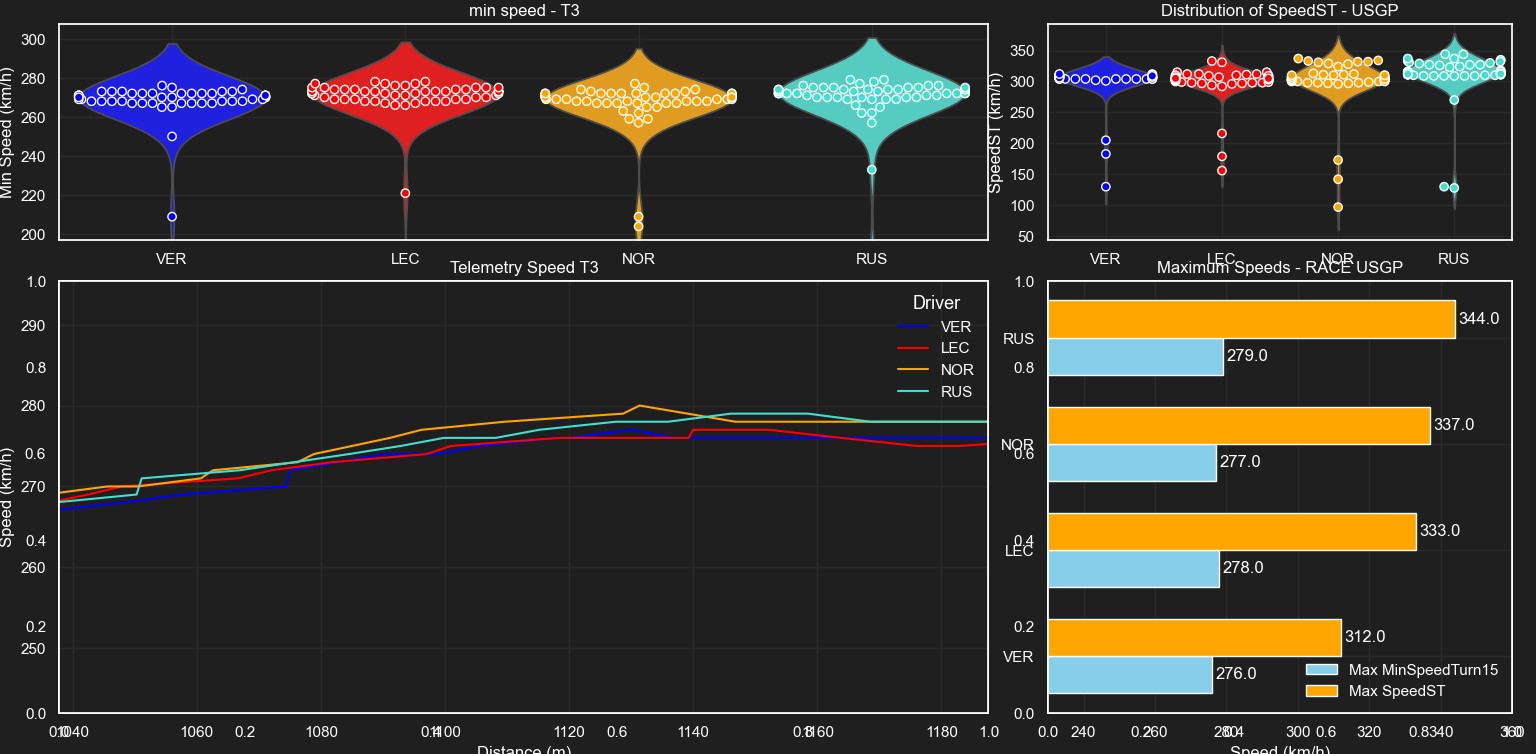
As in the previous curve we go to observe first the maximum values and then the diffusion in the race: this time the difference between the four drivers taken into observation is not high, In fact from the fastest, that is George Russell with 279 km/h there is a difference of only 3 km/h from the slowest "related to this curve", which in this case is Max Verstappen.
Immediately after we find again in second position the Monegasque with only 1 km/h difference and in 3rd place instead the British McLaren with 2 km/h difference from his compatriot.
This time there is a similar scenario for the spread throughout the race: in fact the peak of the curve of the violin plot (ie min. speed most recorded during the race) of the driver of Mercedes and that of the driver of Ferrari is similar, and is approximately 272 km/h, while for the contenders direct to the WDC it is about 270 km/h.
TURN 4 ANALYSIS:
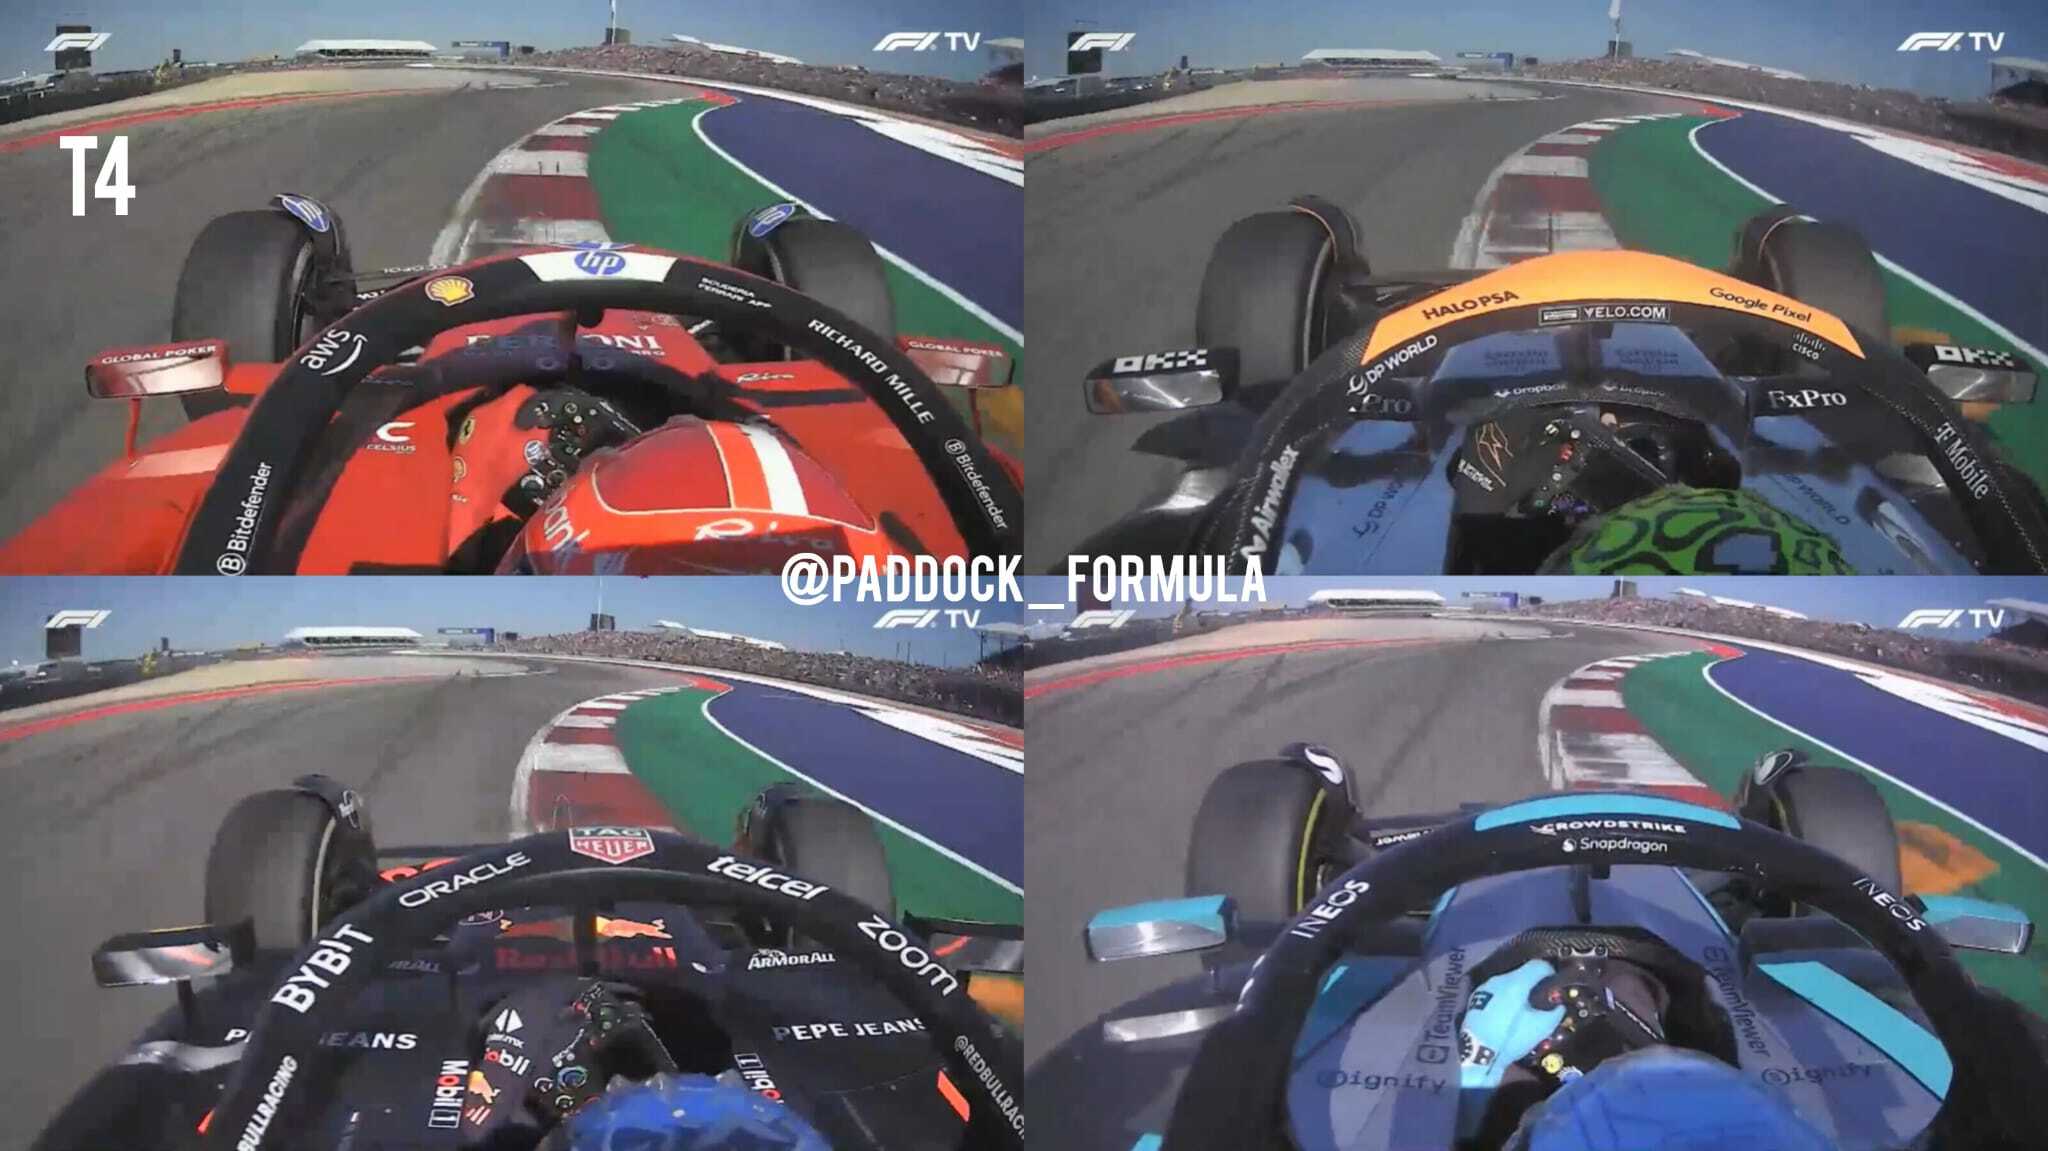
This time the less aggressive driver from the German team is the Briton, while the other drivers have a similar approach to the T4, especially Leclerc and Norris, while Verstappen takes the turn with less aggression on the inner curb (the difference is really small).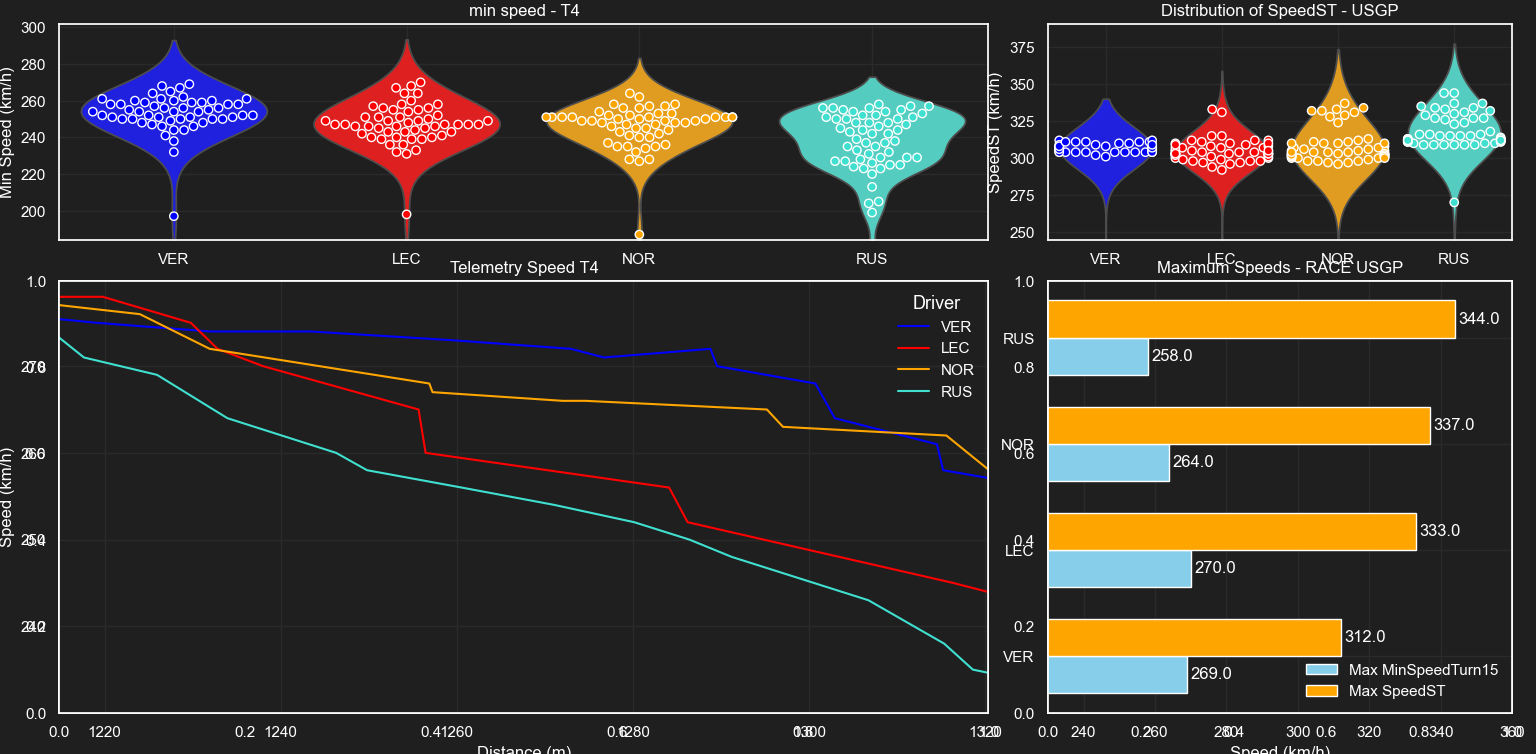
Even if Leclerc holds the max min speed compared to the other drivers, on the spread in race it is immediately noticed that it is Verstappen to have a considerably higher peak than Leclerc and the others, This time you can also see it with the telemetry available under the violin plot.
In fact, even if Leclerc is only 1 km/h faster than Verstappen, as far as the peak of the density curve is concerned, that of Monaco is about 248 km/h, while that of the Dutch is a good 254 km/h (always about, soon I will not specify that it is not a totally precise value but an approximate one).
We are talking about a difference of 6 km/h, difference that will decrease in the case of George Russell, as you can see has a greater spread of values than the other pilots, recorded so a less noticeable peak, the difference decreases by 2 km/h.
In comparison to Norris the situation is similar to that of Leclerc.
TURN 5 ANALYSIS:
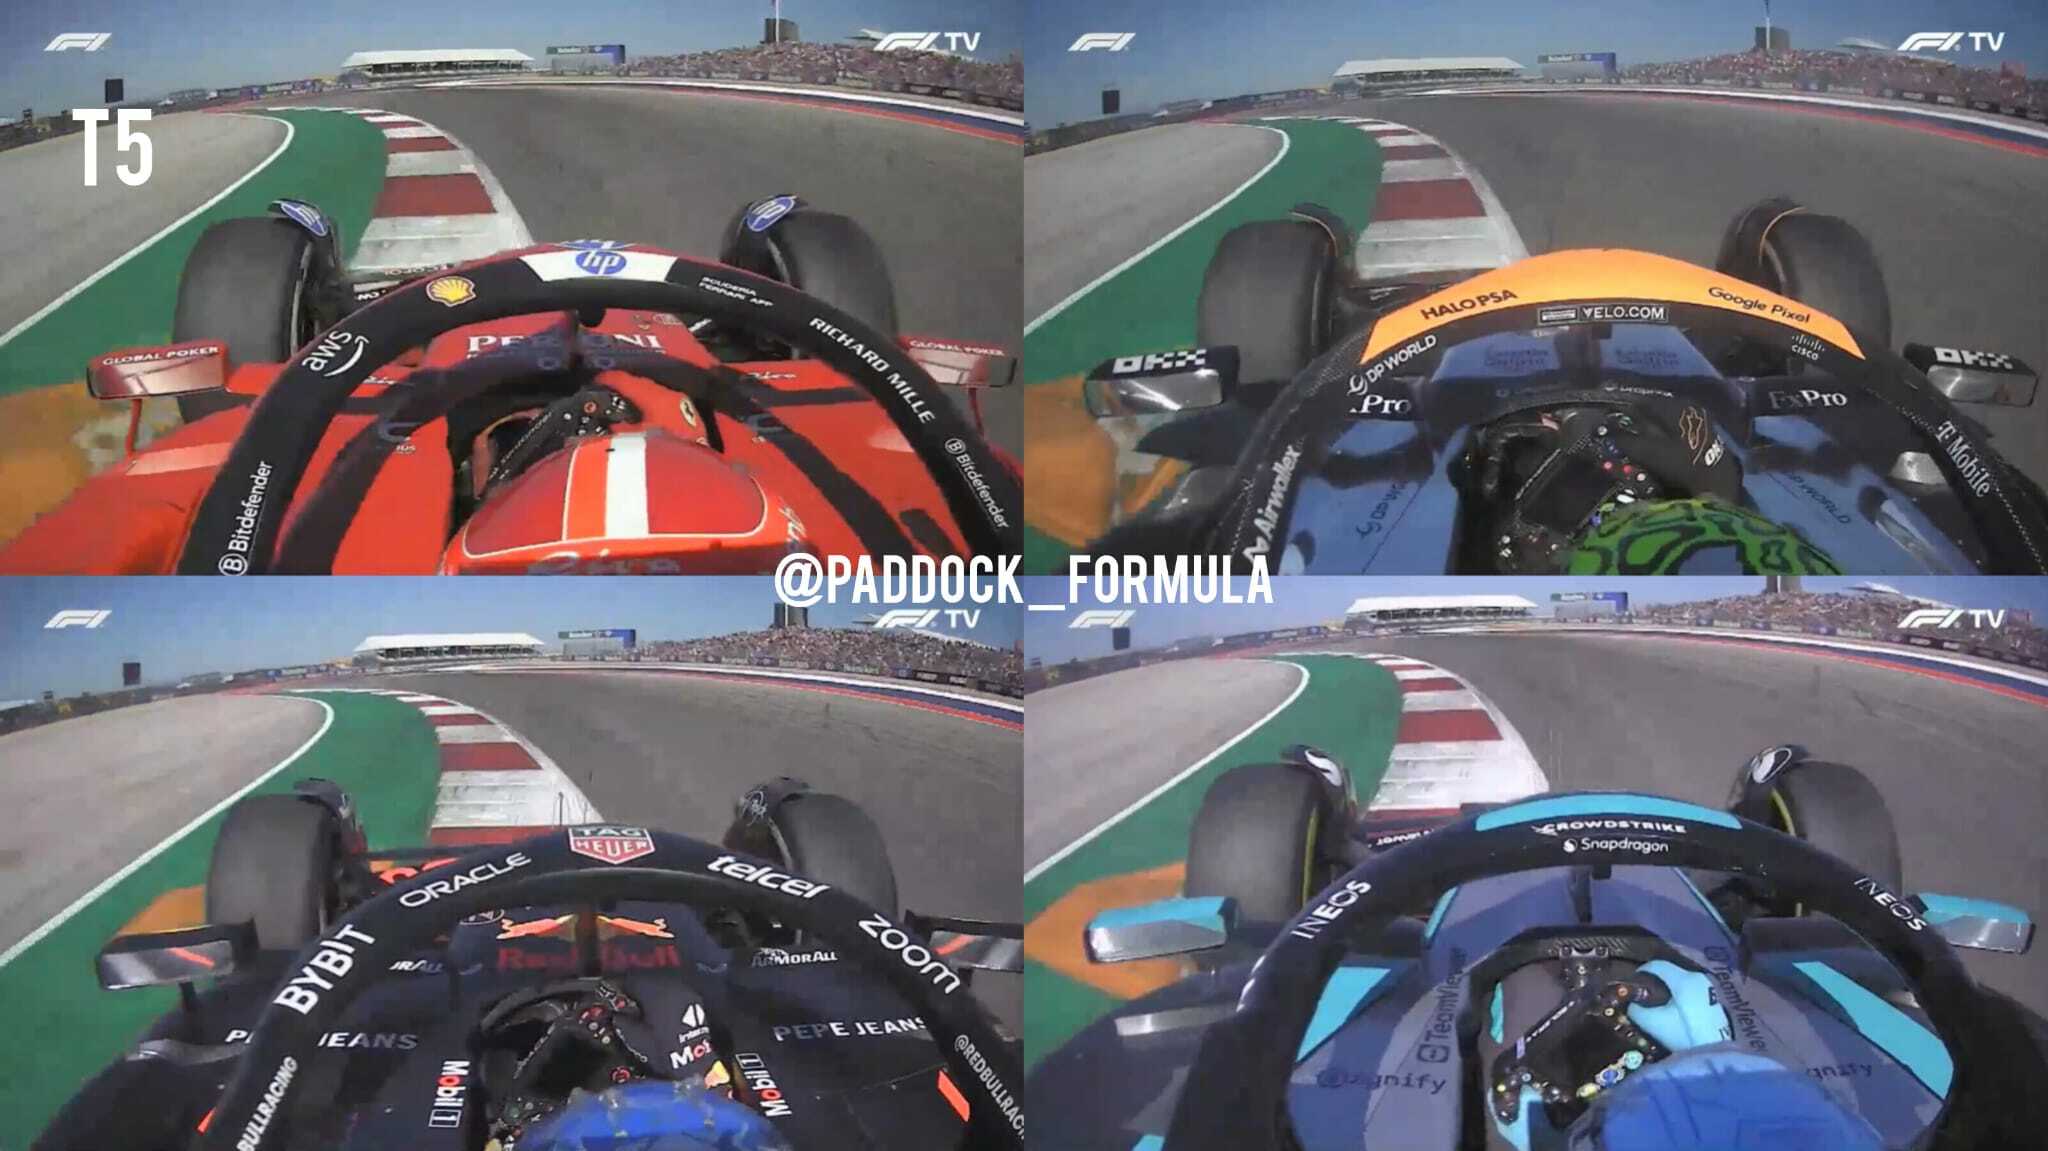
This time the Dutch are more aggressive on turn 5, followed by Leclerc and Russell and finally the British from the English team.
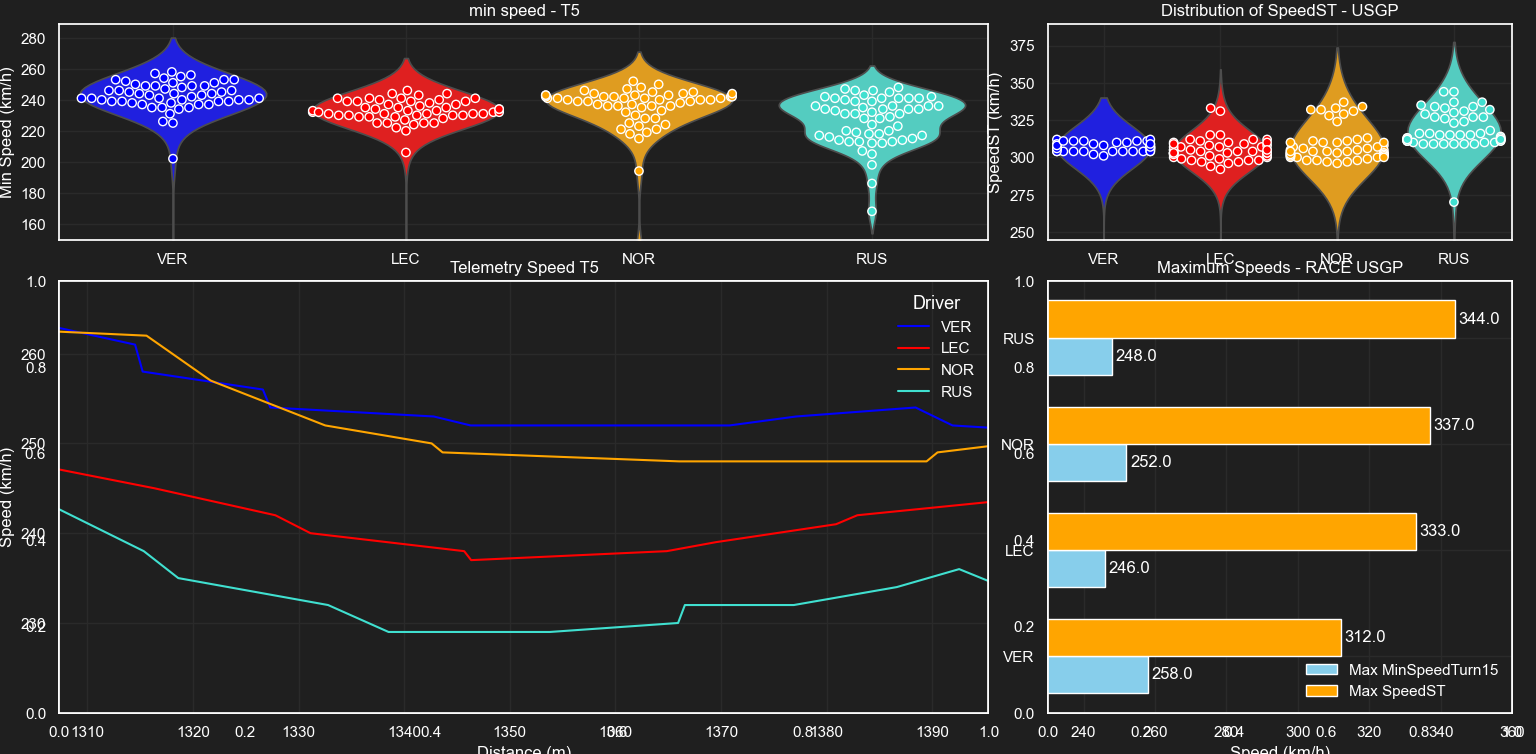
This time the Ferrari of the Monegasque is last both with regard to the max min speed in T5, but also when it comes to the peak of the density curve. In fact, as for the max min speed that corresponds to only 246 km/h compared to 258 km/h of the RB20 of the current champion, if we look at the value to which the peak corresponds, the winner’s speed is 232 km/h against 242 km/h of the three-time world champion, a difference of 10 km/h, which would seem to increase from curve to curve.
George Russell is the penultimate in this ranking, in fact as max min speed records 248 km/h, a difference of 10 km/h compared to that of Verstappen, and a peak of 238 km/h, higher than that of the monegasque 5 km/h.
And finally in second place, we find Lando Norris, who with a driving "opposite" to that of his main rival gets a max min speed of 252 km/h, less than 6 km/h and with a peak of 241 km/h, only 1 km/h slower than the RB20 which caused him a lot of problems in the last laps of the race.
TURN 6 ANALYSIS:
The analysis of curve 6 will be slightly different from the previous ones because we will go to observe the way in which they deal with the curve both in and also in the output, because we will notice several ways of dealing with it:
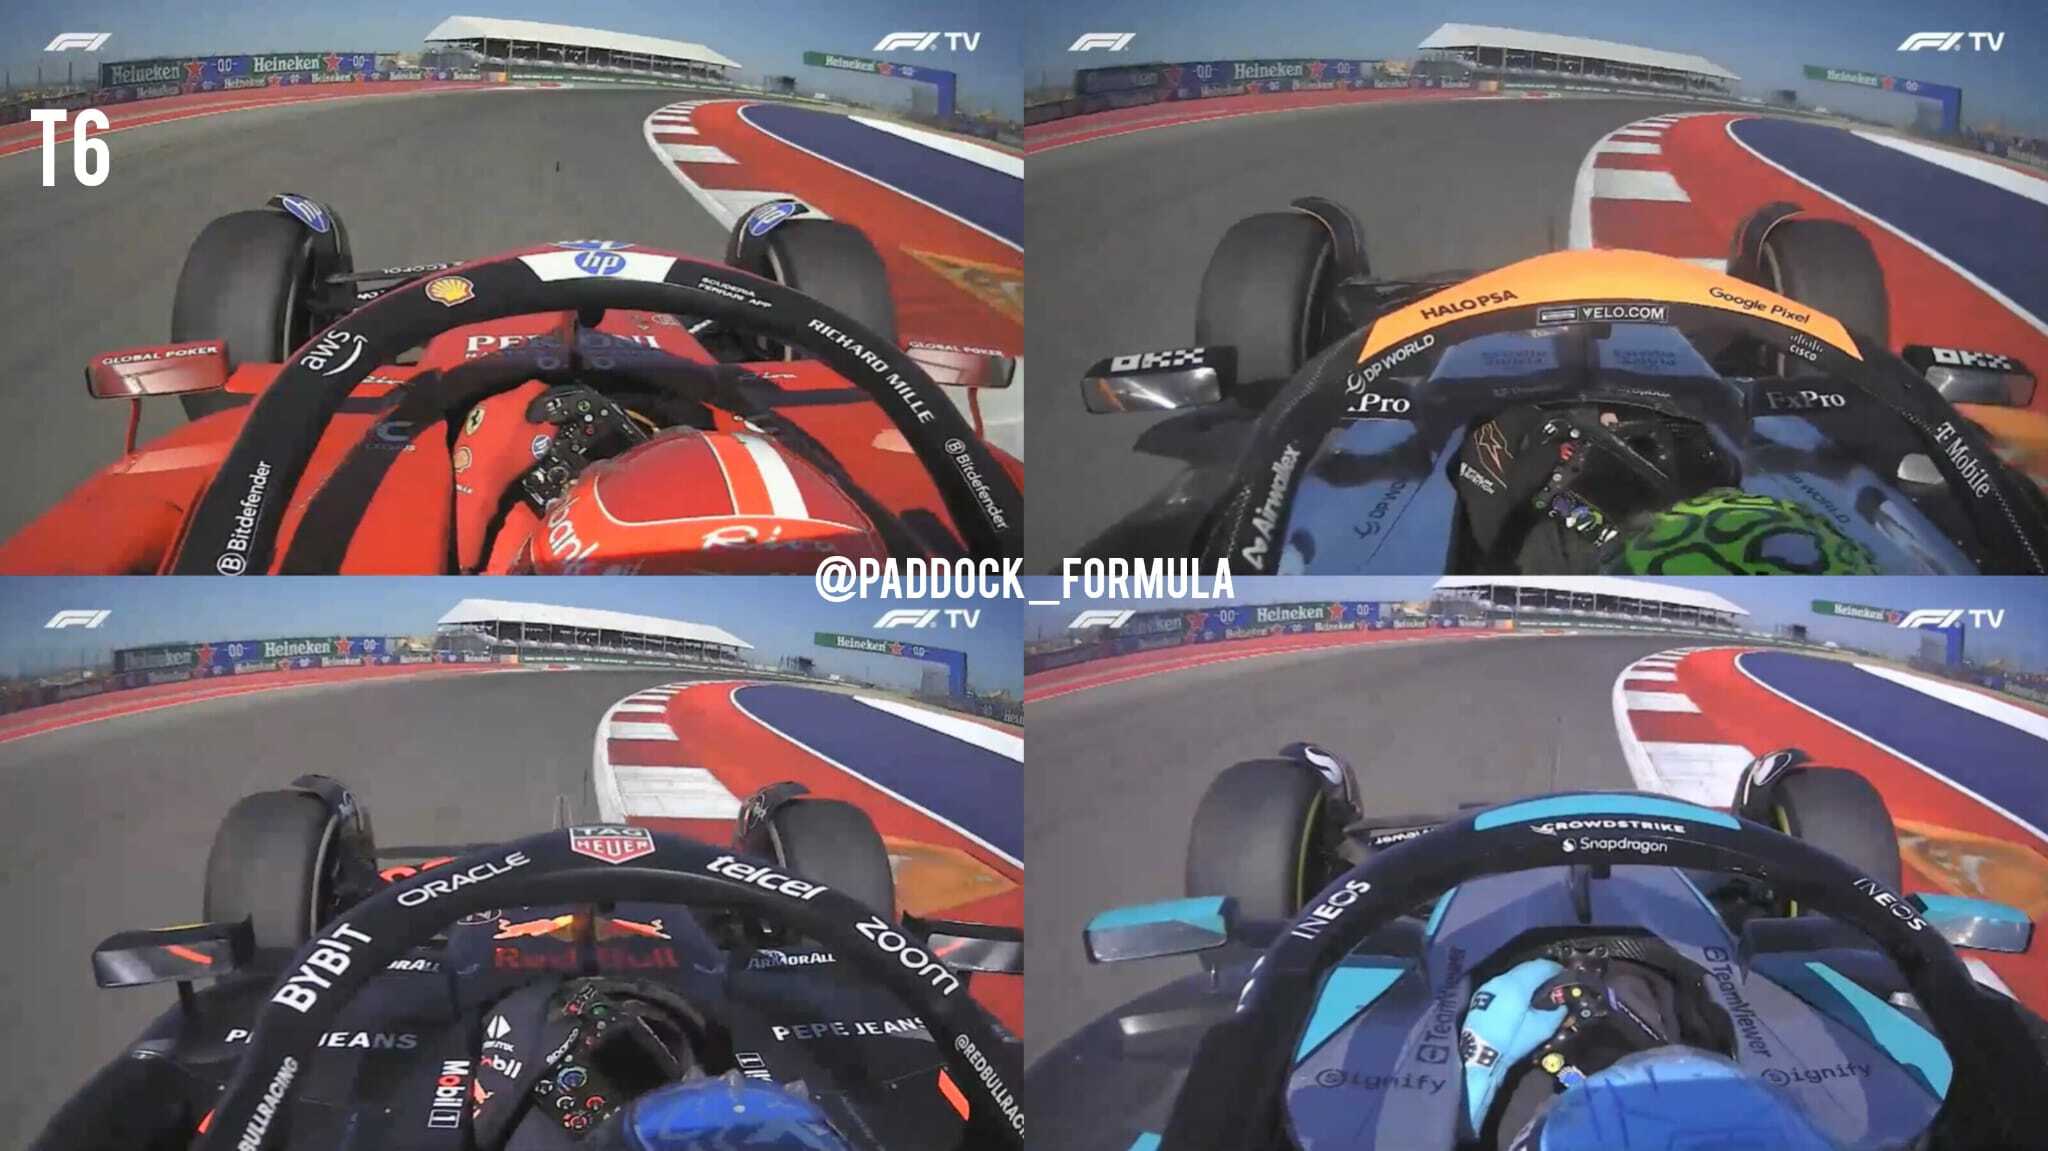
In the entry phase, W15, RB20 and McL38 are the ones that are more aggressive on the inner curb, while SF24 seems to avoid taking it, and you will see that they tend to widen in the central part of the curve, then close in the exit phase:
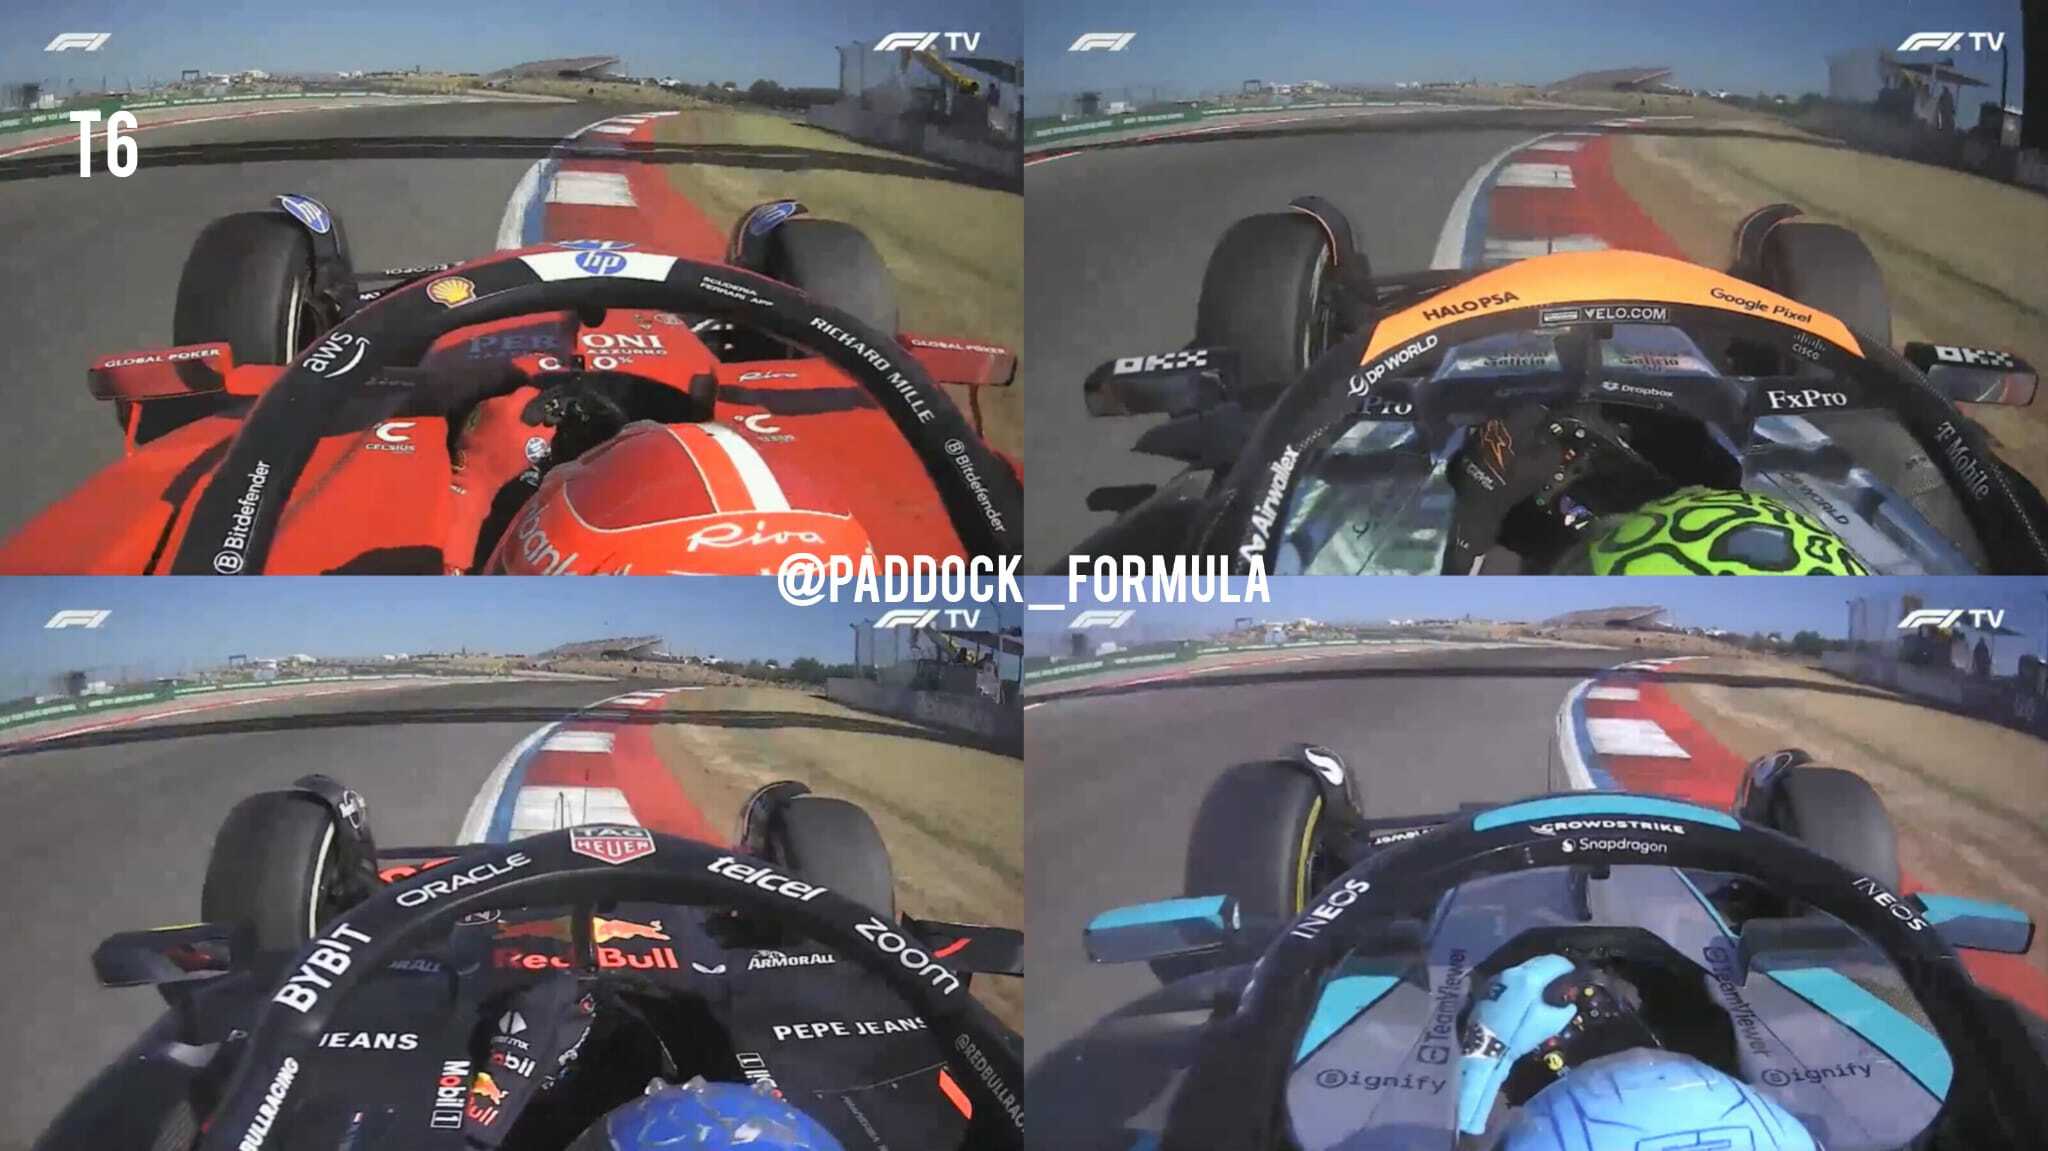
Even if I could not get all four drivers the same point, you can still understand how they deal with the exit. The Ferrari on the way out is more aggressive than the one on the way in and does so with greater determination than the Mercedes, which is the most "outside".
Instead Norris is among those who faces the curve in a more determined manner on the inner curb both in the entry phase and in the exit phase (really at the limit in the exit phase) immediately after Verstappen, who also faces the exit in a decisive manner.
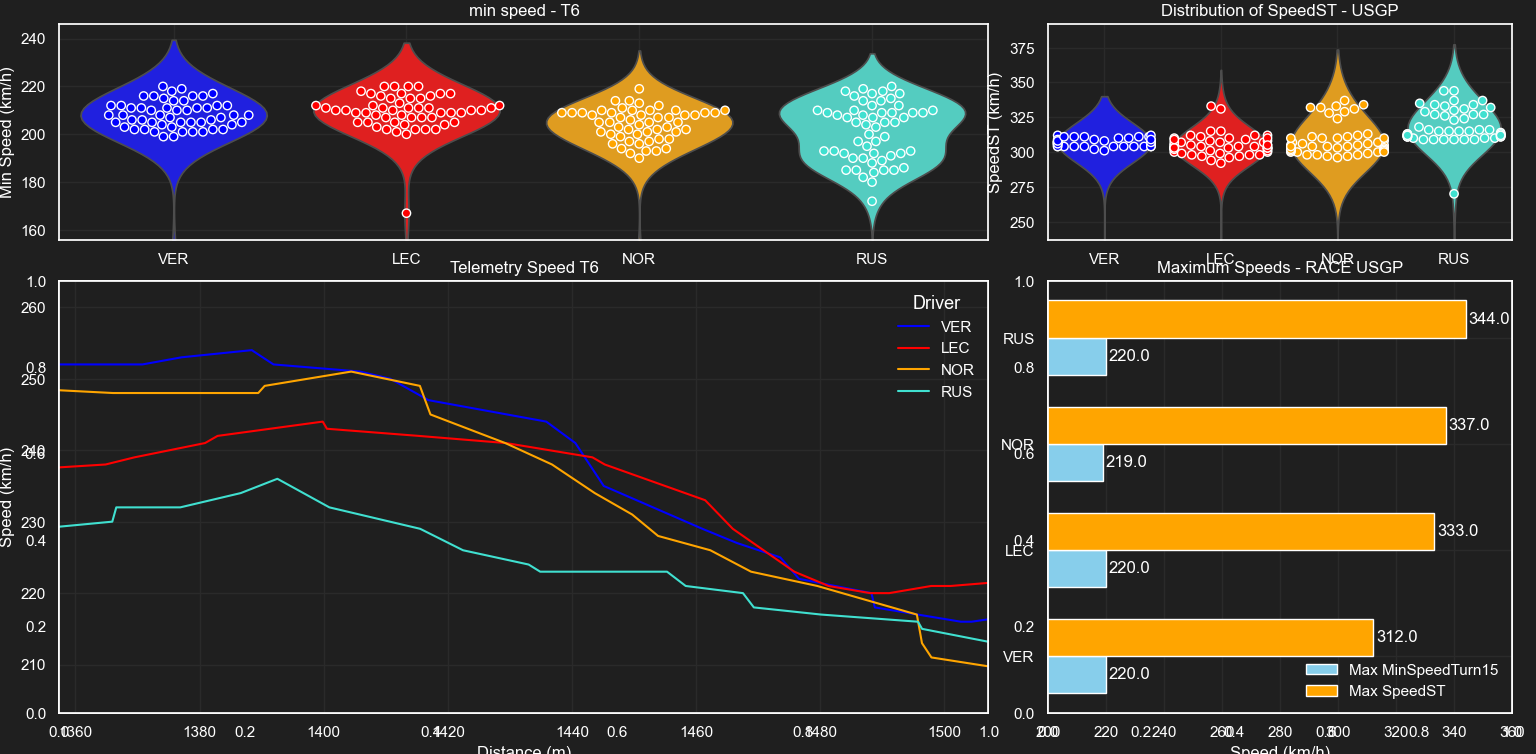
Unlike what I expected in this curve even if there were several ways to tackle it, especially the one of Ferrari, the max min speed is identical for all except for Norris but only 1 km/ h.
As for the peaks of density curves: the SF24 from Leclerc is first with 211 km/h, in second place we find instead the Mercedes from Russell with 210 km/h, in third the RB20 from Verstappen with 208 km/h and finally in fourth place the McLaren from Norris with only 205 km/h.
In conclusion, it was interesting to note that in each curve there was a different scenario, and we could see that the points where Ferrari lost time, probably are the T4 and the T5, and there is no part of this stretch where it excels unlike the RB20 of Verstappen.
This is my first detailed analysis, I have a lot to learn so I would be very pleased if you leave me a comment below this article on the points to improve, thank you for your support!
Commenti
Posta un commento